
Juicing The Market, One Repurchase at a Time
The Most Powerful Factor in Asia: The Buyback Factor

Disclaimer: By reading this article, you acknowledge and agree to the terms and conditions
In Buybacks We Trust
Screening
Putting It Together
In Buybacks We Trust.
Asian equities have long been considered value traps, and it’s not hard to see why. Over the last 20 years, the HSI (Hong Kong), Topix (Japan), and Straits Times Index (Singapore) have underperformed the S&P 500 by a significant margin.
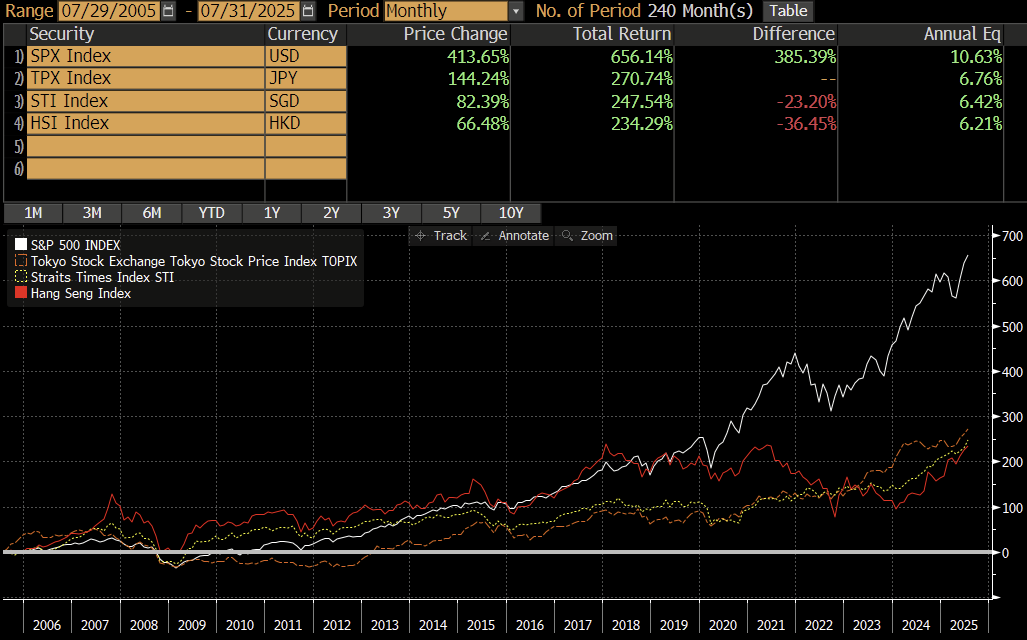
Much of this differential is due to the US’s superior economic expansion and the S&P’s incredible earnings growth, but an often under-discussed piece of the puzzle is capital management.
American companies are ruthless when it comes to using financial engineering to maximize shareholder value.
Take Transdigm, for example. Not only does the company operate with negative equity and leverage of 3.8x ($17 B of net debt on $4.7 B of EBITDA), they announced plans today to borrow an additional $5 Billion to fund a “special dividend”. This would cause the average Japanese or HK CEO a heart attack, but to an American, it’s just business as usual.
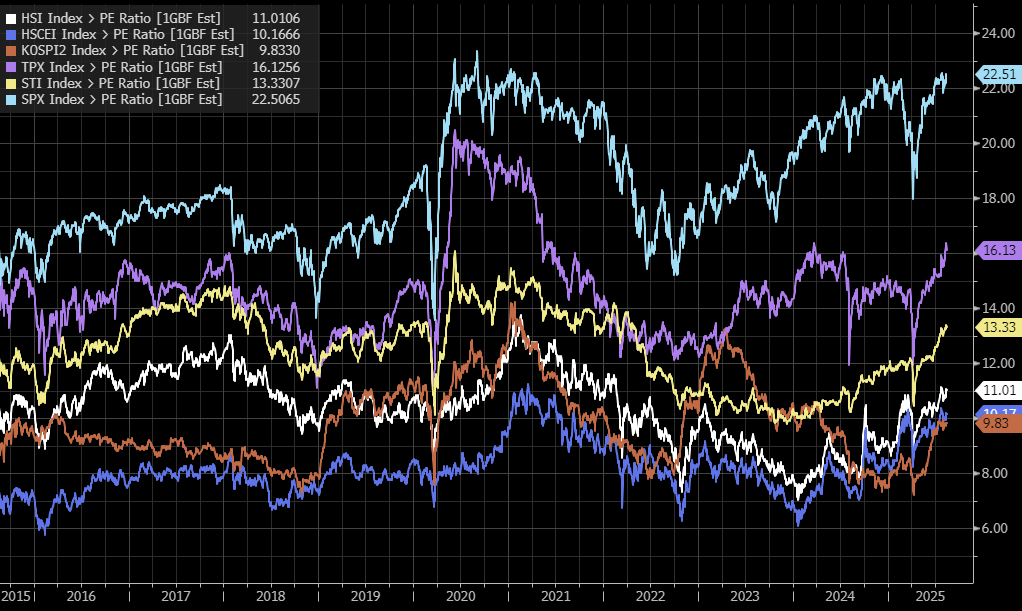
Recent regulatory reforms and government initiatives are pressuring more and more companies in South Korea, Japan, Singapore, and China to be more active on the capital management front. Many of these countries have observed how the United States and Australia have turned their markets into perpetual wealth machines by encouraging active capital management and passive investment by the public, and are eager to emulate this for themselves. This gets me interested, especially given that all Asian indices trade at a steep discount to the S&P 500 despite having near-zero interest rates (making it easier to buy on margin).
The Asian regulatory push for active capital management is commendable, but it also overshadows a select few companies who don’t need to be told: they’ve been doing the right thing for decades.
Before we go further, don’t look at the legend on the graph below, and try to guess what the chart is of.
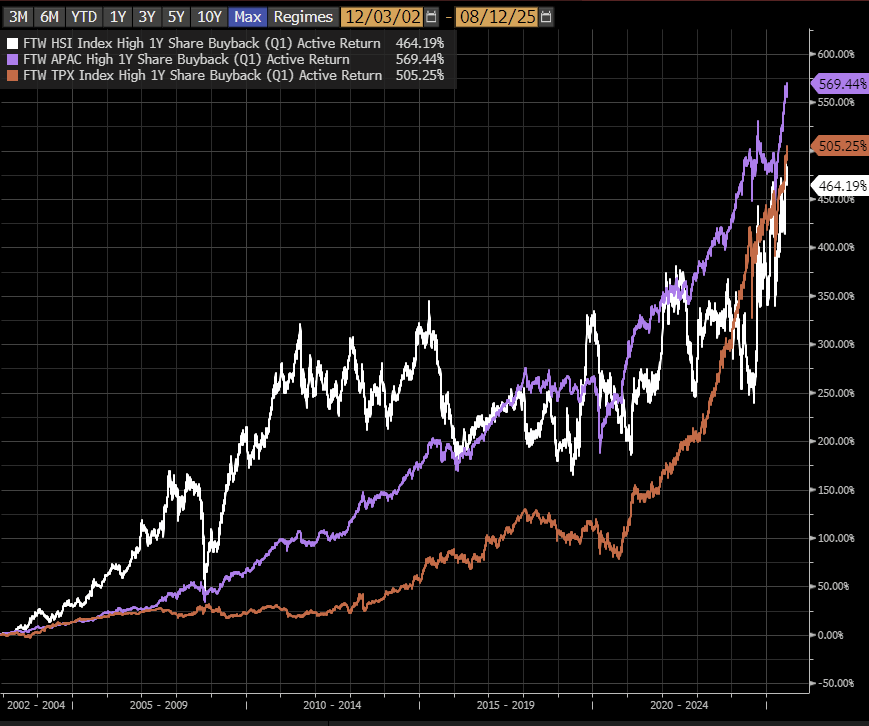
Is this the equity curve of an advanced quantitative strategy, a multistrategy hedge fund, or the average life of a tech investor? Guess again.
It’s the active performance graph of the share repurchase factor within Asian equity indices.
The share repurchase factor is simple: rank all index components in descending order by percentage of outstanding shares repurchased within the last 12 months. This graph outlines the outperformance relative to the index if you went long the top quintile of the repurchase factor (20% of the list) relative to the benchmark.
Whether you look at the HSI, BBG APAC, or Topix, the result couldn’t be more clear: repurchasers outperform.
There are many reasons why this is the case. For starters, buybacks tend to separate real operators from those that are cooking their books; it’s extremely rare for frauds (frequently on HKEX) to have the cash to meaningfully repurchase stock. Additionally, buybacks practically serve as a filter on cash flow, capex intensive, struggling, businesses simply don’t have the capacity to repurchase stock. Finally, and perhaps most importantly, buybacks are indicative of whether a company is truly being run for the benefit of shareholders.
Japan and Hong Kong are rife with subsidiary listings or closely held companies where cash is siphoned to related parties of the insiders, or worse, used for low return M&A so executives can pursue an ill-conceived power trip. The last thing these guys tend to do is return cash to the shareholders, so the presence and execution of a buyback almost always removes these types of companies from a buyback factor strategy.
This isn’t to say that any Asian company with a buyback is unquestionably better than peers, or that a company without a buyback can’t be a winning position for you. Of course, anything is possible.
Still, Asian value investing hinges equally on forecasting earnings and assessing whether profits will actually be returned to shareholders. Who wants to own something at 4x earnings if you’ll never see a dime of the cash? In this context, the presence and execution of a buyback has huge signaling value in Asia. It shows management is serious about capital allocation and is committed to maximizing shareholder value.
The results clearly show that the deck is stacked in favor of repurchasers - if there is one thing you takeaway from this article let it be this: the buyback factor works in Asia.
Given a value screen in Japan or Hong Kong can turn up hundreds if not thousands of results, why not add in a screen for buybacks to help refine your list?
Screening.
It’s important to contextualize Asian buybacks with overall capital returns. Baby steps are fine; if a company pays a 4% dividend and starts repurchasing 2-3% of shares outstanding a year, I’m interested.
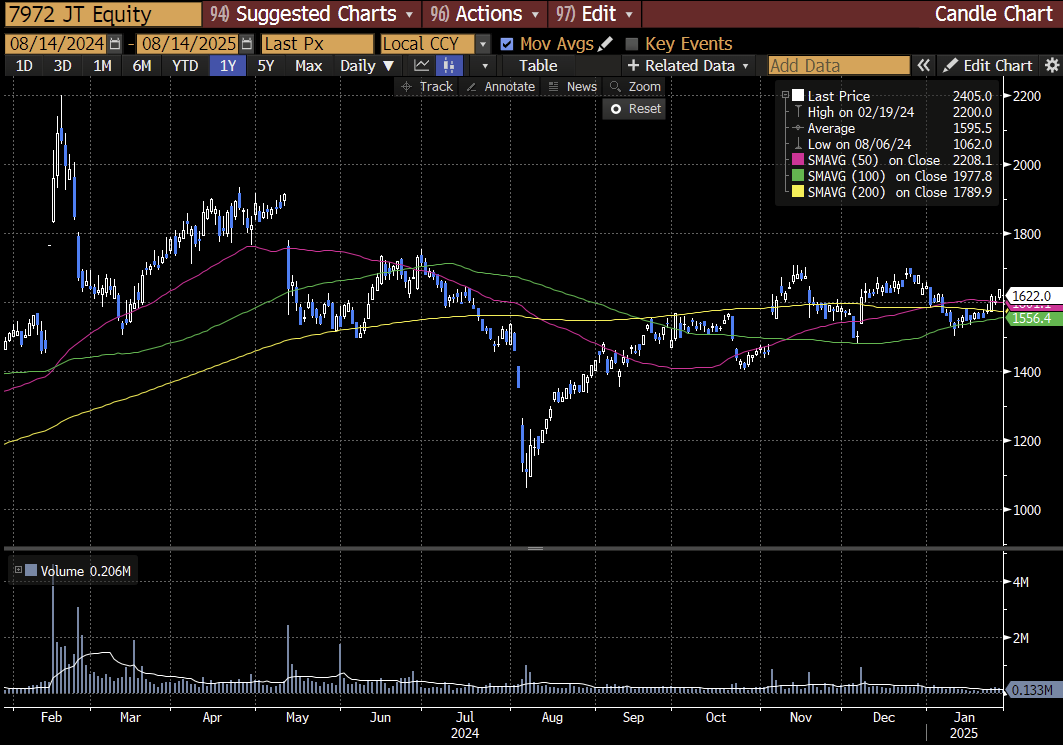
I prefer names that execute a repurchase in a slow-and-steady manner. A few Japanese and Hong Kong names like to announce sizeable 5-10% buybacks that lead to an immediate pop, but ultimately these maneuvers lead to an unfavorable repurchase execution and the moves tend to fade quickly.
For example, Itoki 7972 announced it would repurchase 10% of shares in a block transaction in February of 2024. The price spiked 33% within two days (leading to an unfavorable repurchase price), and the stock retraced the entire move over the next twelve months.
Screening for repurchases is simple on Bloomberg. My rule of thumb is to add a repurchase filter within my screen for names that have bought back at least 2% of outstanding shares within the last 12 months.
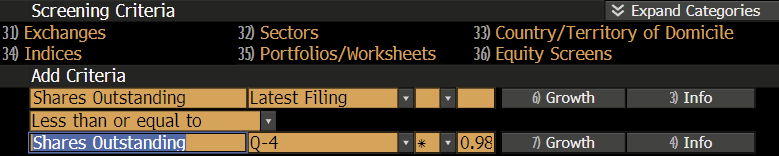
You can accomplish this on EQS by inputting Shares Outstanding as of the Latest Filing on the first line, is less than or equal to Shares Outstanding 4 Quarters ago x 0.98 on the second line (When you input Shares Outstanding in the second line, give it a few seconds, and then click the dropdown arrow to the right of Latest Filing on the second line, then select customize period).
If you want to filter for companies that have repurchased 3%, replace 0.98 vs 0.97, etc. Of course, you can also change the revelavant time frame by selecting Q-8, etc. Unfortunately, this method will exclude any names that have repurchased shares and also conducted a stock split, but by and large it gets the job done.
It’s pretty easy to screen for share repurchasers on Koyfin as well. Although Koyfin doesn’t allow for custom formulas when screening, there is a simple workaround.
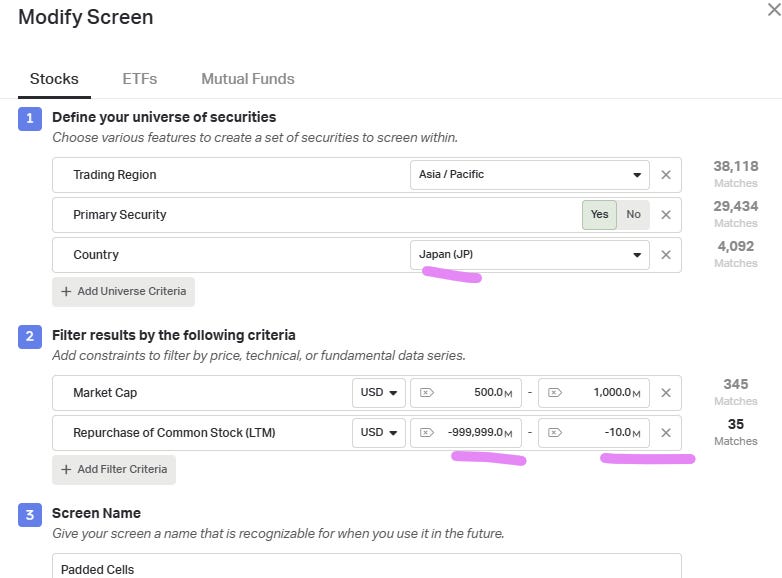
If you are screening for companies in the 500 Million to 1 Billion Market Cap range who have repurchased at least 2% of Shares Outstanding, you just need to do some mental math. Any company that fits this criteria would have spent at least 10 Million on repurchases, so select the Repurchase of Common Stock Field and set the lower bound to -999,999 Million and the upper bound to -10 Million.
If you are looking for names in the 5 Billion to 10 Billion Market Cap range who have repurchased at least 2% of shares, you’ll need to modify the upper bound to -100 Million.
You shouldn’t blindly jump into a company due to the mere presence of a share repurchase program. Nonetheless, if you have two equally compelling setups with similar fundamentals at a similar valuation, why not go for the repurchaser? The repurchase program itself skews the risk-to-reward of the trade since the company is actively supporting the stock price, and furthermore, the data shows that Asian share repurchasers tend to significantly outperform the broader index. Now, let’s get into two names that have caught my eye.
Putting It Together
I’ve been increasing my exposure to Asia. I think the tailwind of passive investment and capital management is beneficial to the indices overall, and I’ve been focusing on names with a global presence that trade at depressed, local valuations.